Category: WSPR

  • K3 and digital modes

    Using WSJT-X as my example digital program, here are the steps to getting digital modes to work with the K3 using an external sound card, the ASUS U7.

    The process is almost identical to the one I use with the KX3, an external soundcard dongle and a MacBook Pro.

    First, it is simple and easy to adjust and repeatable.

    Connections:

    Line in on the K3 rear panel is connected to the Headphones socket on the front of the Asus U7 (using red patch cord with ‘Line in’ label).

    Line out on the K3 rear panel is connected to the Microphone socket on the front of the Asus U7 (using black patch cord with ‘Line out’ label).

    RS232 on rear of K3 is connected via USB adaptor to unused USB connector on the PC.

    USB socket on rear of Asus U7 is connected to another USB connector on PC. (this also provides power for the Asus U7).

    software:

    Asus (Xonar U7 Audio Center) to confirm selection of Headphones and Line-In, and to adjust levels

    WSJT-X File > Settings or F2 >

    General tab: Enter your callsign and grid square

    Radio tab: Select Elecraft K3/KX3 in Rig drop-down list

    Set serial port to same COM Port number revealed when you are using

    Elecraft K3 Utility (But both programs cannot be run at same time)

    Set baud rate to 38400

    Data bits 8     Stop bits One    Handshake  None

    PTT  – select CAT     Port should be USB

    Transmit Audio Source is Rear/Data

    Mode is Data/Pkt

    Split Operation is set to Rig

    Use Test CAT and Test PTT button to confirm correct connections. CAT will turn Green and PTT Red after clicking, indicating all is well.

    Audio tab:

    Under Soundcard select the appropriate option from the drop down lists:

    Input – ‘Line (2-Xonar U7)’

    Output – ‘Headphones (2-Xonar U7)’

    Under the Reporting tab you can enable or disable uploading of spots to PSK Reporter and linkages to other programs include logging software.

    Under the Frequencies tab – if you find there are no frequencies listed for the different modes, position cursor in the Working Frequencies window and right click and select ‘Reset’. This should populate the window with all the frequencies.


    Use the PC’s regular audio device controls or the soundcard’s controls to adjust input and output levels. For example WSJT-X likes to have the green input bar graph on the lower left of the application window indicating about 30dB. Adjust the Headphones level to achieve this. I operate routinely with it hovering between 30 and 60dB.

    The K3 is particular about the level of ALC on its transmit signal. You can use the microphone level to easily achieve the Elecraft ideal of 4 solid bars with the fifth bar flickering. This ensures a clean splatter-free signal.


    Other aspects you need to consider with applications such as WSJT-X include installing an application to keep the PC clock accurate, as well as eventually checking frequency alignment.

  • The book I’d like written/to write about FT8, WSPR & other digital modes

    I’ve spent the last couple of weeks spending some continuous and focused time finally getting some consistent results out of my radios using digital modes, especially WSPR and JT8 using WSJT-X.

    Like everything else I do with ham radio, they reveal the woeful inadequacy of my antennas here. In fact, one of the benefits of WSPR is, in fact, the information it yields that provides some useful and comparable data about your antenna performance.  The great thing about WSPR is that the worst antenna still seems to manage to generate some data so that any subsequent ‘improvements’ can be evaluated.

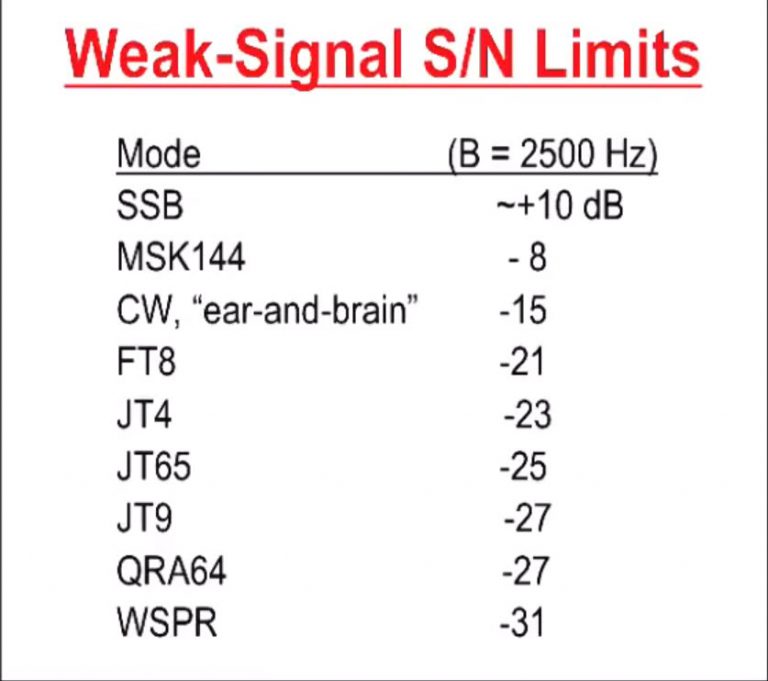
    I have yet to find a document that helps you understand what the numbers especially the SNR actually mean. If you hear a signal at 0dB via WSPR does that imply that a CW signal at the same power output or some number of dB power increase would also be able to be copied? These kinds of questions are what leads me to think that there would be high interest in this kind of information. Even if there isn’t that potential market, it’s still an idea worth pursuing out of personal interest. I’d also like to read an explanation of what the variation of SNR numbers from the same station indicate about changing ionospheric conditions etc – what is significant, and what is within the range of normal statistical variation.

    I’d love to know how to really make use of the data gathered by WSPRnet. What techniques do people use to manipulate and analyse the data? Also, there are presumably assumptions that need to be tested or acknowledged. Many people running a WSPR beacon leave the radio and antenna untouched – so it’s a constant – but others might explicitly be using WSPR to run tests of new antenna equipment so that the antenna is changing and not a stable element. I have been using it for exactly this over the last few days and noticed a significant increase in the number of reports and the quality of the signals reported in response to an extra metre in height of an antenna over the comparable time of day. But maybe the changes are within the range of normal day-to-day variation – especially at the current low phase of the sunspot cycle.

    But I’m confident that a consistent user would be able to make some pretty reliable assumptions based on extended observations about what beacons could be considered constant if only from their numbers over the months. It would be great if there were some functions developed that could be accessed online on the WSPRnet site to analyse numerical qualities and features of the more consistent and reliable beacon stations. It would require some computer grunt I suppose to host these server-side processes which might be beyond the budget of the current setup. Whenever the number of concurrent users exceeds 120-140 the WSPRnet site regularly seems to crash and takes quite some time to recover.

    It would be great to gather info on the different ways people use WSPR data. How much do professional space weather researchers use the immense volumes of data now being generated? I understand that Australia’s Space Weather Services staff do use it. As I write this WSPRnet announces it has counted over 952 million spots and is adding over a million every day!

    I would love to see how people have used data gleaned via WSPR to generate views of how propagation changes during the day for different bands, or how to synthesise the same data into an informative comparative analysis of antenna systems.

    Sotabeams DXplorer system – sold as part of the WSPRlite package – performs some interesting analysis of the WSPR data to generate logarithmically(?) scaled graphs of the distance of WSPR reports. It would better if somehow the formula underlying any comparison was able to also take into account the different power levels used.

    I would also like to have a concise explanation of frequency calibration. The material K1JT includes was authored almost a decade ago. I’m unsure whether the latest versions of the application accommodate these procedures. I suspect they do as there is a need to do it. I am noticing a deviation in my reported frequency cored to what I calculate it should be. It’s quite out of the ballpark. Similarly, the variation amongst ‘reporters’ is relatively wide. Simple and direct advice about how to deal with this and fix it would be great.

    There’s probably still some room to think about more ways to exploit the potential of the massive group of users for various types of experiments investigating propagation etc. Using the different modes it’s amazing how they can illustrate the variety of space weather behaviour. Earlier tonight while using FT8 on 20 metres, I saw the band suddenly go blank. It was as if the antenna had been disconnected. It recovered a little later.

    Also, different ways of using the applications – especially WSPR – can lead to quite different impressions about what is actually going on. Running WSPR in band hopping mode in late evening creates the impression that there is no activity at all across those bands. However locking the system onto one band – 40 metres here – reveals a deeper level of ongoing activity that the thinner sampling of the band hopping mode misses representing.

    At a more nitty-gritty level, I would like to know how best to use the different modes. Gary Hinson G4IFB/ZL2IFB’s FT8 Operating Guide is very clear. The main WSJT-X User Guide seems to me to be more about the program rather than practical information about using it. It seems to assumes a high level of background and technical familiarity. I suppose I’d prefer documentation that describes explicitly and in a good level of practical detail how people are using the applications. I think it’s brilliant that the WSJT-X application is available for MacOS and Linux as well as Windows and even for the Raspberry Pi!

    I wonder how far away we are from radios – kit or commercially produced – that are designed just for FT8 and nothing else. I think Adam Rong – a seller of QRP kits and radios developed and built in China – is about to offer such a radio.

    As someone who has spent an inordinate amount of time *not* managing to get digital modes to run on my radios for a long time, I am delighted that in the last few weeks I have been able to get three of my Elecraft radios to successfully decode. It all seems so simple to me now, so that I can’t understand the barrier was before. Well, I think it may have been what I’m writing about here – the lack of suitably written documentation. What got me off on a successful run was a very simple PDF file about running sound card digimodes on the KX2 using a cheap soundcard dongle. It also took into account the Macintosh – so my first success was using the KX2 and my MacBook Pro. It was totally simple and easy to migrate the whole approach across to a KX3 when I wanted to run that much more power. Watching the PA temperature on the KX2 rise during a WSPR transmission – getting up to 53 degrees C on 2 watts – was exciting. I then substituted the Asus Sonar U7 sound card in place of the dongle. And then when I wanted to crank up the power a bit more for FT8, I migrated over to the K3. It was very satisfying to be able to adjust the Power slider in the WSPR mode to get the four solid bars of ALC with the flickering fifth. Also to get a clear sense of the actual level of the signal in that was required to get the decodes to start appearing.

    At the moment I’ve been snatching data from the WSPRnet reports, taking a snapshot of the map view of my transmissions over say a day, and also taking snapshots of HamCAP each hour of the day’s propagation predictions for that band.
  • Back in the loop

    My main project for at least the last 12 months has been building a solid magnetic loop antenna and its companion automatic loop controller. I’ve been roughly tracking its progress at my magnetic loop antenna project page on this blog.

    As usual, life has got in the way, but I want to get back on track and complete the project. To start pumping some RF current through it again, over the weekend I spent a short time playing with the loop on WSPR on 40, 30 & 20m. The tests were too brief but they certainly confirm that the loop is capable of transmitting a signal in spite of the fact the loop is only half a metre above ground and surrounded by metal garden furniture, a steel framed awning and gutters.

    I used the WSPR Beacon android app to control my transmitter. There was some discrepancy (tens of Hz) between the actual output frequencies on the app and those shown on WSPRnet. I also found that tuning the loop to each WSPR frequency using the iP30 antenna analyzer was easy and the KX2 gave lower SWR figures.

    The brief test became an exercise in understanding theWSPRnet results taking into account propagation and loop orientation which was aligned north-south.


    POSTED ON

    Back in the loop

    My main project for at least the last 12 months has been building a solid magnetic loop antenna and its companion automatic loop controller. I’ve been roughly tracking its progress at my magnetic loop antenna project page on this blog.

    As usual, life has got in the way, but I want to get back on track and complete the project. To start pumping some RF current through it again, over the weekend I spent a short time playing with the loop on WSPR on 40, 30 & 20m. The tests were too brief but they certainly confirm that the loop is capable of transmitting a signal in spite of the fact the loop is only half a metre above ground and surrounded by metal garden furniture, a steel framed awning and gutters.

    I used the WSPR Beacon android app to control my transmitter. There was some discrepancy (tens of Hz) between the actual output frequencies on the app and those shown on WSPRnet. I also found that tuning the loop to each WSPR frequency using the iP30 antenna analyzer was easy and the KX2 gave lower SWR figures.

    The brief test became an exercise in understanding theWSPRnet results taking into account propagation and loop orientation which was aligned north-south.

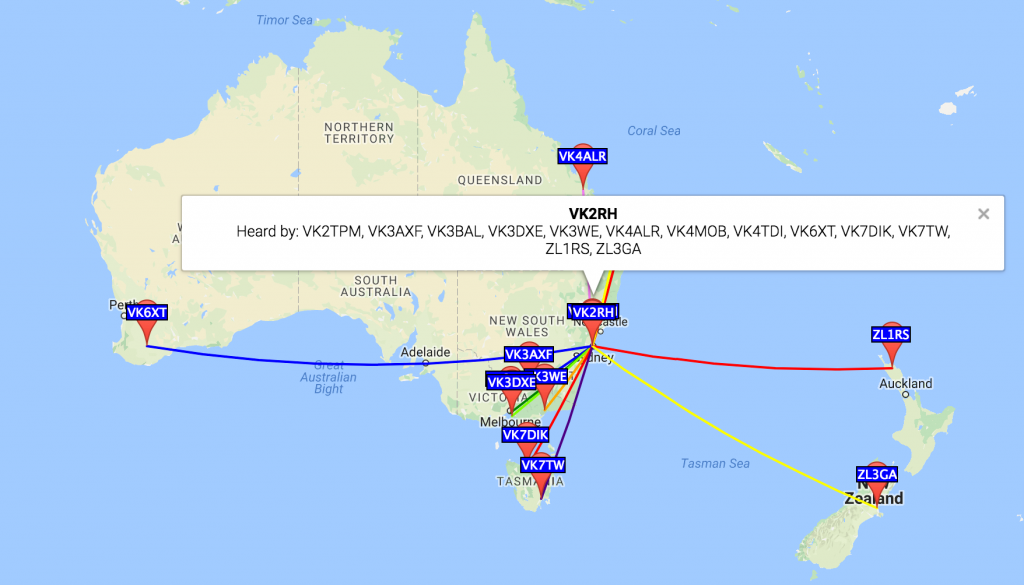
    This map view combines all 20 spots of the 1W VK2RH transmissions from grid square QF56oc. The first test was logged at 2017-05-07 01:36 UTC. (I’ve trimmed repeated info from the chart below to improve its fit on the page.)

    TimeMHzSNRDriftReporterRGridkmaz
     05:24 14.097001 -15 1 VK4ALR QG56fk 1151 356
     05:24 14.097016 -26 0 VK4TDI QG62lm 733 14
     04:48 10.140109 -22 0 VK4TDI QG62lm 733 14
     04:48 10.140094 -23 0 VK7TW QE37pc 1057 198
     04:48 10.140091 -17 0 VK6XT OF86td 3086 261
     04:40 10.140095 -27 0 VK7TW QE37pc 1057 198
     04:40 10.140090 -4 0 VK3WE QF32se 547 216
     04:40 10.140090 -22 0 ZL1RS RF64vs 2069 101
     04:40 10.140092 -15 0 VK6XT OF86td 3086 261
     04:40 10.140091 -16 0 ZL3GA RE66ho 2130 126
     03:18 7.040121 -24 0 VK3BAL QF22mc 711 230
     03:18 7.040134 -7 0 VK3AXF QF33fn 516 235
     03:18 7.040135 -18 0 VK4MOB QG62ol 734 16
     03:18 7.040130 -18 0 VK3DXE QF21nv 720 228
     03:18 7.040128 -12 0 VK2TPM QF56of 14 0
     03:18 7.040129 -14 0 VK7DIK QE38cu 918 207
     01:36 7.040183 -16 -1 VK3AXF QF33fn 516 235
     01:36 7.040177 -16 -1 VK2TPM QF56of 14 0
     01:36 7.040184 -24 -1 VK4MOB QG62ol 734 16
     01:36 7.040179 -21 0 VK3DXE QF21nv 720 228

    40 metres favoured north-south, while 30 metres was literally an all-rounder and 20 metres was too brief. These results probably say more about propagation than the loop, not to mention the heavy lifting done by all the reporter stations extracting my down to -26 or -27 dB signals from the noise! Impressive all round!

    I wonder how many people are using the Sotabeams WSPRlite antenna tester device. Certainly looks tempting, especially for longer term antenna evaluation.

    In any case, the main purpose of today’s exercise was to re-start the loop project. The To Do list includes

    • building & installing the SWR bridge into the loop controller,
    • deciding on the best way to couple the stepper motor shaft to the tuning capacitor shaft,
    • and wiring it all together with appropriate coax and control cables.
  • And they’re racing!

    Interesting thread on the softrock40 email list about how easy it is these days to get a good sense of how well your station and the ionosphere are performing in an almost ‘hands-free’ way.

    Increasingly modes like WSPR and tools like SDR have enabled us to let the radio do its thing and in a short amount of time access detailed logs of our successes – where we were heard. The softrock40ers were using this approach to compare their SDR rigs performance to other sets.

    Rob KL7NA joined in the conversation. He pointed to his recent paper on what he calls ‘Robotic radio‘ that he presented to the DCC meeting in Vancouver WA recently.

    Your radio is doing what the operator used to do automatically, and as you have been finding out, it is really fun to horse race different software demodulators, receivers and antennas, and radio locations this way.  I am trying to promote it as a way for our youth to get into amateur radio.  They seem to be very enamored by robotics.

    Rob’s paper is full of interesting ideas and he lists the building blocks of Robotic radio… hardware, software and networks. He introduces his open source project CW Robot which is still in alpha and explains the thinking behind it.

    This looks like a very rewarding place to play and discover – and there’s already a road map.

  • WSPR

    Prompted by Julian G4ILO’s musings about the possibility of volcanic ash being responsible for propagation he observed a few days back, I’ve been looking deeper into WSPR, the application that produced the data that inspired the notion.

    First stop was the main WSJT site where Princeton physicist Joe Taylor K1JT outlines the application along with other weak signal communications applications. The WSPR page points to the 20pp. User’s Guide (pdf).

    There’s also some information at the WSPRnet site – especially the stunning map and the detailed database of recent spots.

    Map of WSPR contacts

    Full circle – when I searched for a general introduction to the software and the mode it’s based on – sure enough I end up back with Julian, G4ILO. He’s published a very readable and comprehensive article which quite rightly comes up #4 on a WSPR google search. He describes how easy it is to become part of a global beacon network and contribute to the generation of up-to-the-minute propagation reports.

    Right now, I’d really like to know how to interpret the colour and thickness of the lines tracing the transmission paths on the map.

  • Joe Taylor K1JT presentation on WSJT-X

    Joe Taylor, K1JT gave a 75 minute long presentation on WSJT-X at the recent MicroHams Digital Conference in Redmond Washington in mid March.

    This link takes you to the section within the full day’s 8 hours and 21 minutes long recording.

    This link takes you to a version edited by Budd, WB7FHC of the same talk.

    During the presentation, Joe Taylor showed this slide indicating the comparable signal to noise limits resolving different weak signal modes compared to traditional modes like SSB and CW.